如何使用
Debugger for Chrome这个插件在vscode中进行debugger调试。
项目地址: Ewall1106/mall
如何使用 Debugger for Chrome 这个插件在 vscode 中进行 debugger 调试。
vscode 中安装这个扩展。
vue-cli3.x+ 以上脚手架构建的项目,需要在 vue.config.js 中配置。configureWebpack: { devtool: "source-map";}低版本 脚手架构建的项目,需要先自行设置 source-map 的开启。devtool: "source-map";launch.json 的文件,选择 Chrome 环境。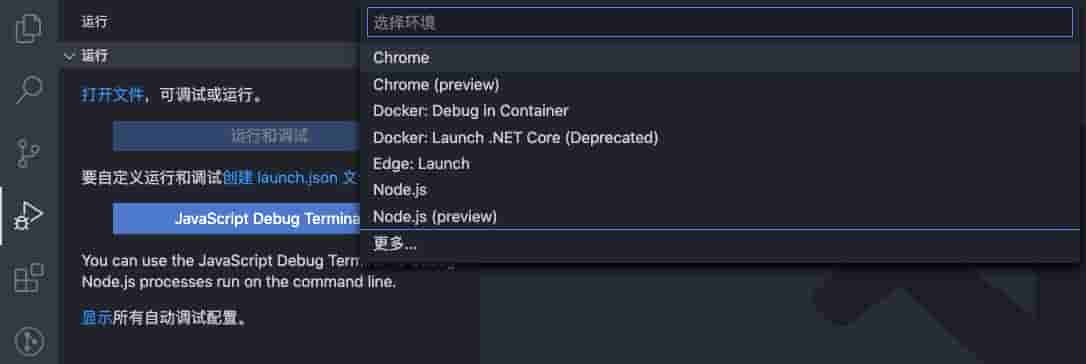
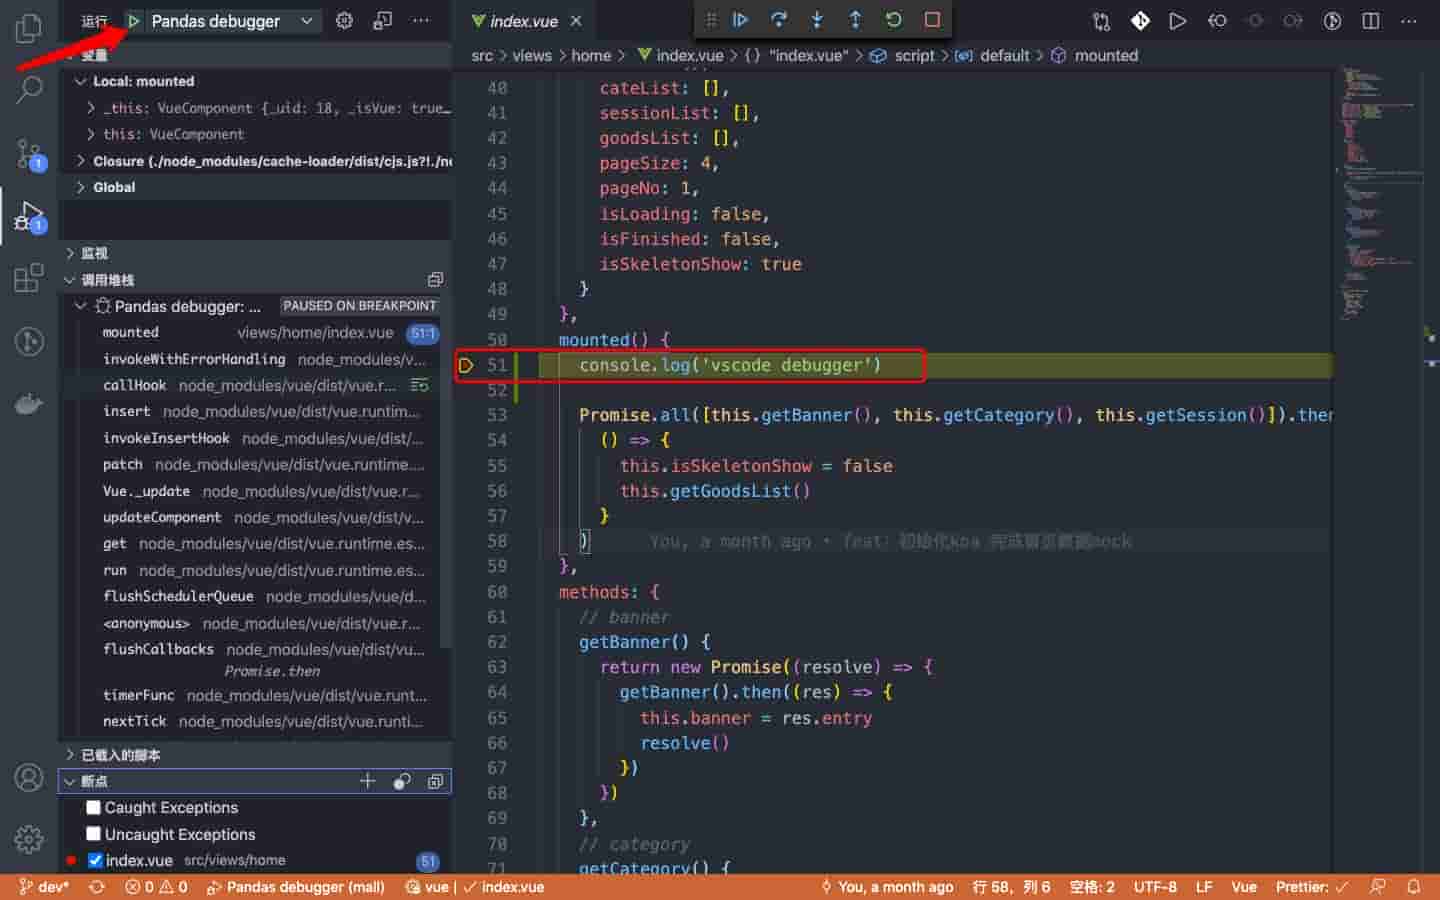
launch.json 的配置内容改为如下:{ "version": "0.2.0", "configurations": [ { "type": "chrome", "request": "launch", "name": "Panda-mall debugger", "url": "http://localhost:8080", "webRoot": "${workspaceFolder}/src", "breakOnLoad": false, "sourceMapPathOverrides": { "webpack:///./*": "${webRoot}/*", "webpack:///src/*": "${webRoot}/*" } } ]}我们在任意位置打个断点测试一下(如下图的51行)。
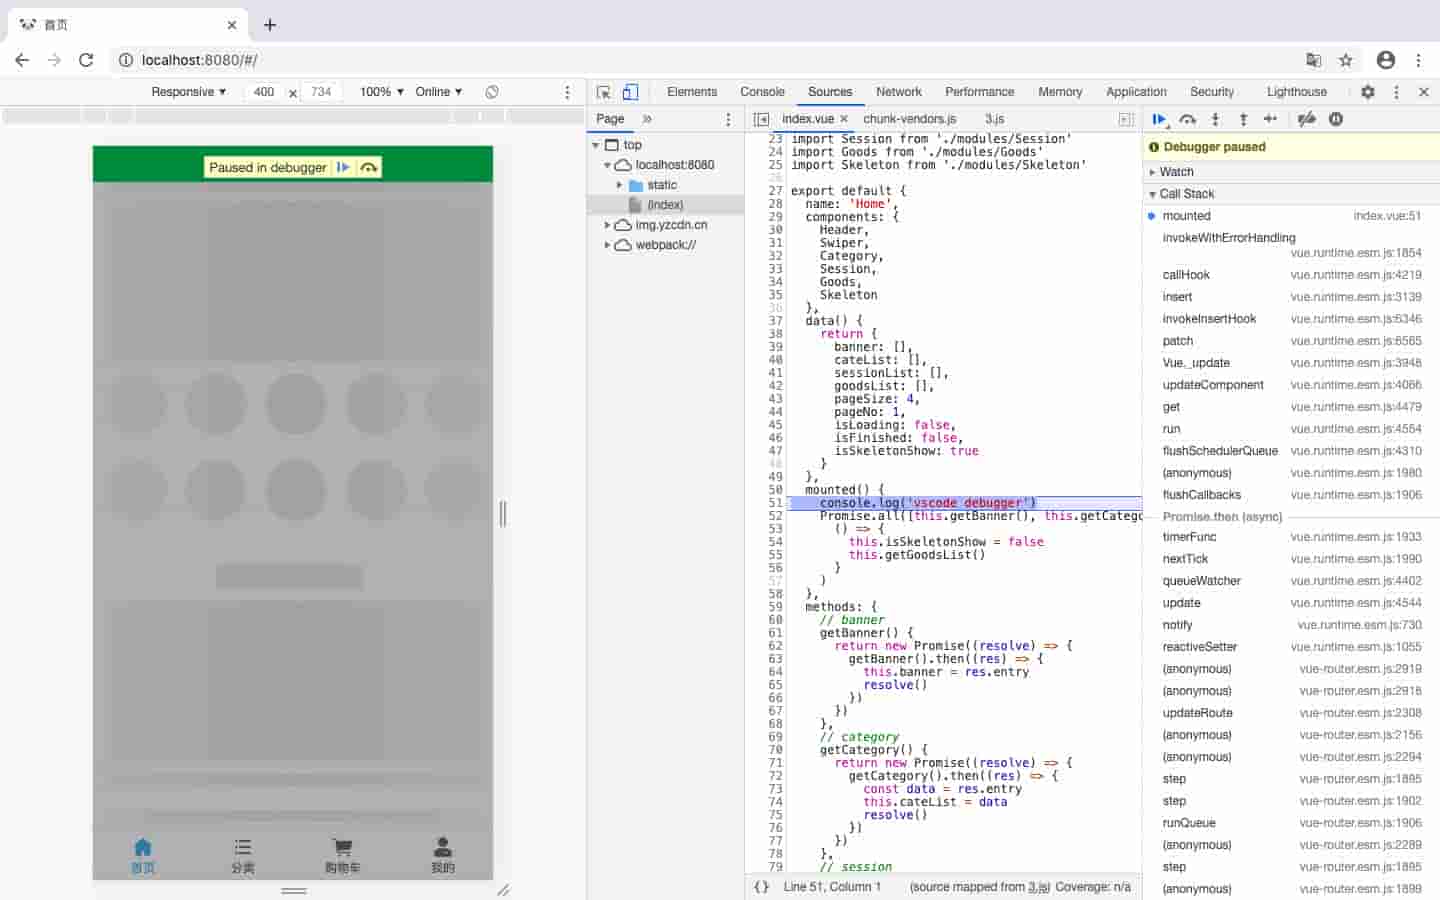
当你点击那个绿色的 play 按钮启动调试的时候,会自动在浏览器中打开 http://localhost:8080 实例,而后vscode 中设置的断点就被命中了。
 image
image